TL;DR
Generic AI research produces generic content. The difference between a blog post that earns trust and one that gets ignored is usually one thing: specific, sourced, dated statistics from real publications. This post covers exactly how I use Perplexity Sonar to pull that research for every blog post before a single word gets written, and why this step is what makes the content credible enough to actually rank and convert.
This is the third post in a series about building a 110-post SEO content strategy from scratch. Start with the overview here or read about keyword mapping here if you missed the earlier posts.
Why Most AI-Generated Content Feels Empty
There is a specific feeling you get when you read AI-generated content that was not properly researched. It is technically accurate. It covers the topic. But it says nothing you could not have guessed without reading it. No numbers. No named sources. No dates. Just confident-sounding sentences that gesture at the subject without actually saying anything specific about it.
That content does not rank well because Google has seen millions of pages that say the same thing in slightly different words. It does not convert well because readers who are evaluating whether to hire someone do not trust vague claims. And it does not build authority because there is nothing in it that a competitor could not produce in three minutes.
The fix is not better writing. It is better research input before the writing starts.
What Perplexity Sonar Actually Does
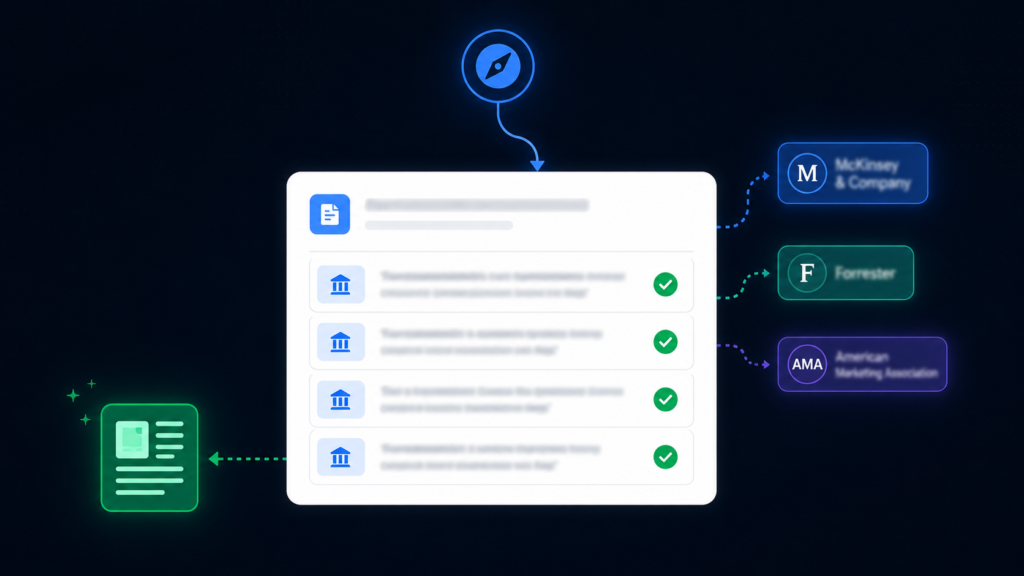
Perplexity Sonar is the API version of Perplexity AI with live web search enabled. Unlike standard language models that draw only on training data, Sonar actively searches the web in real time and returns answers with cited sources.
For content research, this matters for one specific reason. Training data gets stale. A model trained on data from 2023 does not know what the AMA published in 2024 about physician burnout rates or what McKinsey’s 2025 State of AI survey found about how many organisations are actually scaling AI versus still experimenting. Sonar pulls that data live with the source URLs attached.
The goal of research is not to fill a brief with statistics. It is to find the specific numbers that make a claim undeniable. One well-sourced stat from a named publication does more for credibility than ten vague assertions about industry trends.
The Research Prompt Structure
Every cluster in the Tiger Tail project got its own dedicated research prompt. Not a generic “tell me about AI in healthcare” request. A structured prompt designed to return exactly the categories of data the blog posts needed to be useful.
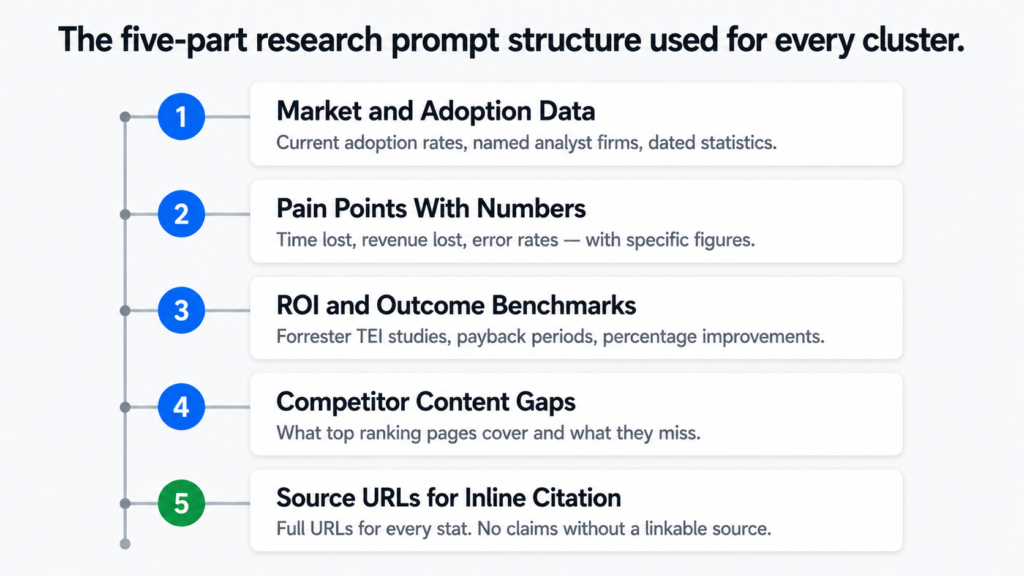
Here is the core structure I use for every cluster research prompt:
Current adoption rates with source and publication date.
How many businesses in this sector are using AI or automation.
Growth projections with named analyst firms.
2. Pain points with quantified data
Specific problems the audience faces, backed by survey data.
Time lost, revenue lost, errors caused — with numbers.
Named studies or reports, not vague attributions.
3. ROI and outcome benchmarks
What results do businesses actually see after implementation.
Forrester TEI studies, McKinsey surveys, industry reports.
Payback periods, percentage improvements, cost savings.
4. Competitor content gaps
Top 5 ranking pages for the primary keywords.
What they cover and what they miss.
Angles that are underserved in existing content.
5. Source URLs for inline citation
Full URLs for every stat returned.
Publication name, author where available, and date.
No stats used without a linkable source.
That structure applies to every cluster. What changes is the industry context and the specific questions asked within each category. A healthcare cluster research prompt asks about physician burnout rates and prior authorisation time. A legal cluster prompt asks about billable hour utilisation and contract review time. Same framework, different inputs.
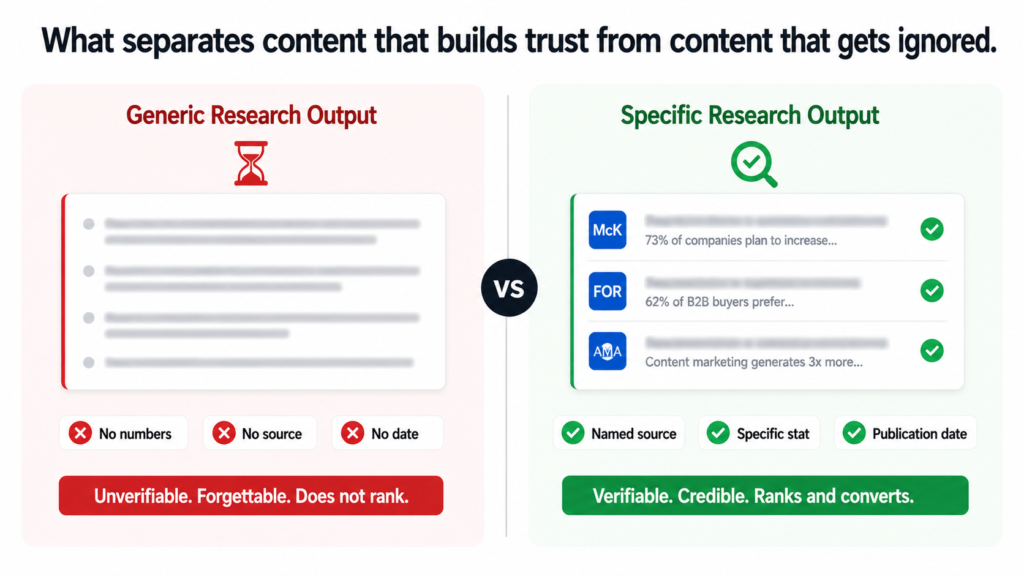
What Good Research Output Looks Like
Here is an example of the difference between weak research output and strong research output for the same topic. Both are about physician burnout. Both are technically accurate. Only one is usable.
research-output-comparison.txt
——————————————————————————————————————
“Physician burnout is a serious and growing problem
in the healthcare industry. Many doctors report
feeling overwhelmed by administrative tasks and
documentation requirements. Studies show that
burnout rates have increased in recent years.”No numbers. No source. No date. No named study.
A reader cannot verify it. Google has seen it
a million times. Nobody finds it convincing.
STRONG RESEARCH OUTPUT
——————————————————————————————————————
“The AMA’s national physician burnout survey shows
that 43.2 percent of physicians reported at least
one symptom of burnout in 2024, down from 48.2
percent in 2023 but still far above 2011 levels.
AMA time-use data show physicians worked 57.8 hours
per week on average, spending 13 hours on indirect
patient care and 7.3 hours on administrative tasks.”
Source: AMA national physician burnout survey, 2024.
URL: ama-assn.org/[full path]
Specific percentage. Named organisation. Year.
Comparison data. Time breakdown. Linkable source.
A reader can verify it. Google can trust it.
The second version took the same amount of writing effort. The difference is entirely in the research input. Sonar returned the specific AMA data with the source URL. The writer used it. The post is now citing a real study from a named authority rather than making a vague claim that sounds like every other article on the subject.
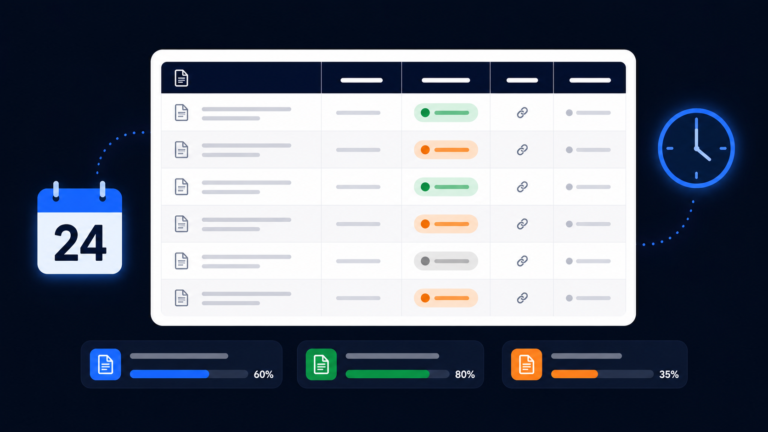
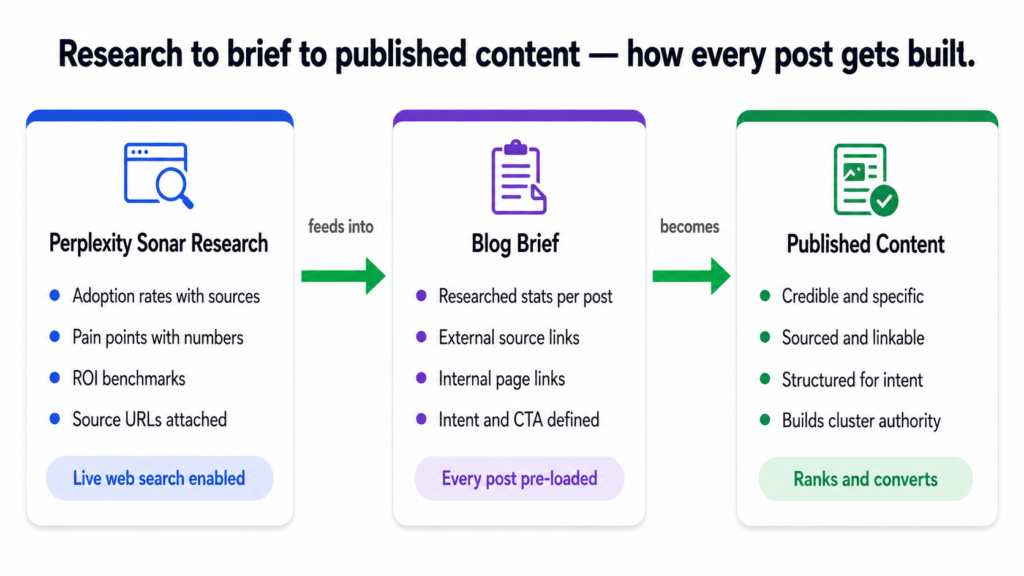
How the Research Feeds the Brief
For the Tiger Tail project, every blog post brief was built around a structured data pack pulled from Sonar. Each brief included the following categories of research:
Full stats, proof points, and findings from Perplexity Sonar.
Sourced from 2024 to 2026 publications only.
Each stat matched to the specific post it would support.
External Links
Full source URLs for every statistic.
Only authoritative domains: AMA, McKinsey, Forrester,
Clio, Gartner, Deloitte, ABA, NAR, IBM, Zapier.
No aggregator sites. No low-authority citations.
Internal Links
Specific pages on tigertail.co to link to naturally.
Parent service or industry page for the cluster.
Related posts within the same cluster.
Search Intent
Informational, How-To, Comparison, or Commercial.
Determines structure, depth, and CTA placement.
CTA
One call to action per post, placed where it earns its place.
Not forced. Not repeated. One clear next step.
With that research in the brief, a writer does not need to go looking for statistics. They do not need to guess what sounds credible. Every claim they make is backed by something real before they write the first sentence.
Why Source Quality Matters as Much as the Stat Itself
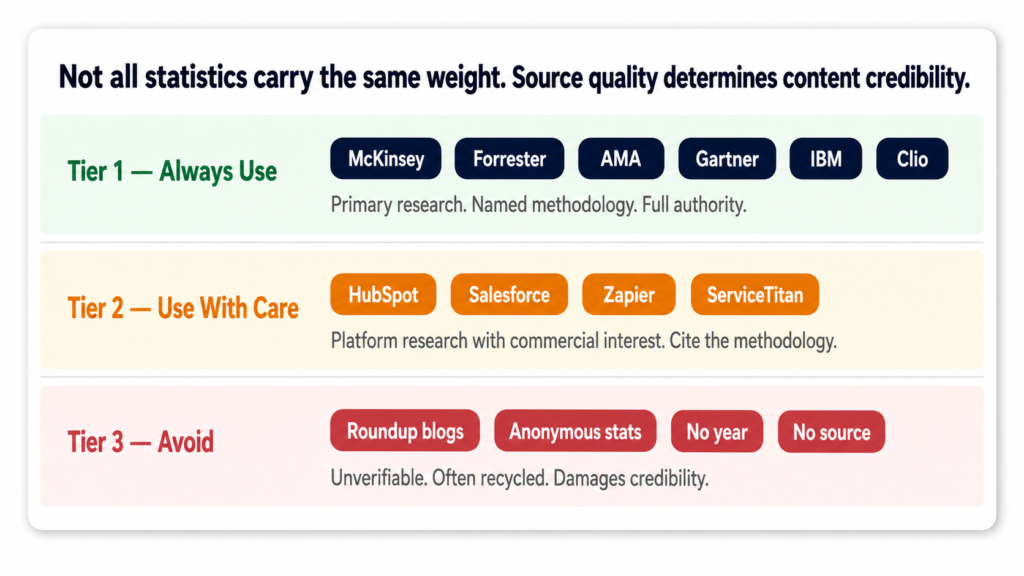
Not all statistics are equal. A stat from a Forrester Total Economic Impact study carries more weight than the same number repeated on a marketing blog. A figure from the AMA national physician survey is more credible than “experts say burnout is rising.”
For every cluster, the research was filtered to authoritative sources only. That meant primary research from named analyst firms, government or professional associations, peer-reviewed publications, and major industry platforms with named methodology. Anything that could not be traced back to a primary source did not make it into a brief.
McKinsey, Forrester, Gartner, Deloitte, BCG
AMA, ABA, NAR, AICPA, HIMSS, Clio Legal Trends
IBM Cost of Data Breach, Zapier State of Automation
Harvard Business Review, JAMA, NEJM
Government data: BLS, CMS, HHSUSE WITH CARE — Tier 2 Sources
Platform research from major SaaS companies
with named methodology and sample size.
Examples: HubSpot, Salesforce, ServiceTitan surveys.
Cite but note the source has a commercial interest.
AVOID — Tier 3 Sources
Anonymous blog posts repeating stats without sourcing.
Roundup articles that cite other roundup articles.
“According to experts” with no named expert.
Statistics without a year or methodology attached.
This filtering step is what protects the content long term. A blog post built on Tier 1 sources stays credible for years. A blog post built on recycled statistics from aggregator sites can be undermined the moment someone checks the original source and finds it does not say what the article claims.
The Real Reason This Step Cannot Be Skipped
It is tempting to move straight from keyword mapping to writing. Research feels like overhead. It adds time to the brief. It requires a tool and a process rather than just opening a document and starting.
But the research step is what separates content that builds genuine authority from content that just exists. Google can identify thin content. Readers can feel it. And in competitive niches like AI consulting, legal technology, or healthcare automation, you are competing against content backed by real data from serious publications. Vague claims do not compete with that.
Every post in the Tiger Tail project started with a research data pack. Every stat in every post has a source URL attached. That is not a quality-control step. It is the foundation the entire content strategy is built on.
What Comes Next
With keyword mapping done and research packed into every brief, the next decision was how to organise all 110 posts into a structure that builds compounding authority rather than just accumulating content. That is what cluster architecture is about and it is what I cover in the next post: why I build content in clusters, not one-off posts.
If you want a content strategy built this way for your own business, including the keyword mapping, Sonar research, and full brief pack, book a call and we can talk through what that looks like for your specific site.
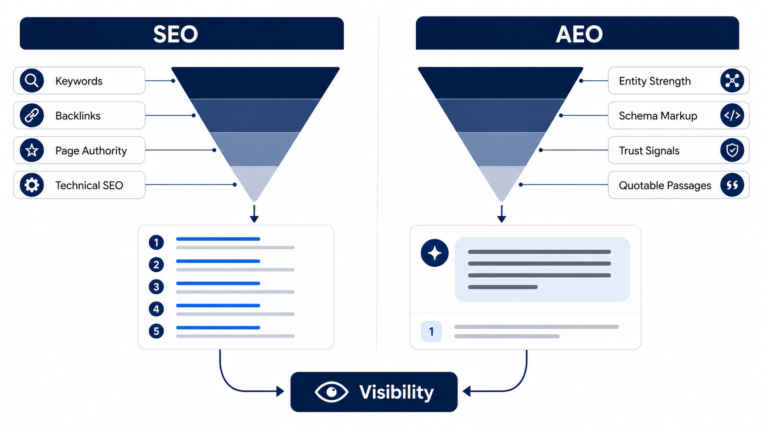
See how I approach SEO strategy →
Learn about AEO and answer engine optimisation →
Dhruv is an SEO consultant working with business owners, founders, and agencies. If organic search is not delivering for your business, this is where to start.

Dhruv The SEO Guy
I do SEO for agencies, founders, and business owners. No fixed packages. No fluff. Just technical, revenue-focused strategies that scale your organic presence securely.
Ready to dominate search?
Stop reading about algorithms and start ranking. Book a quick 1-on-1 strategy call below.
Book a Strategy Call →